Description
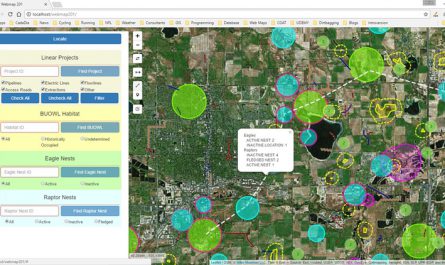
Bokeh prides itself on being a library for interactive data visualization. The graphics are rendered using HTML and JavaScript, and your visualizations are easy to share as an HTML page. You will create a number of visualizations based on a real-world dataset.
The goal of this course is to get you up and running with Bokeh.
You will learn how to:
- Transform your data into visualizations
- Customize and organize your visualizations
- Add interactivity to your visualizations
Download Links
Direct Download
Interactive Data Visualization in Python With Bokeh.zip (510.7 MB) | Mirror
Torrent Download
Interactive Data Visualization in Python With Bokeh.torrent (47 KB) | Mirror


